Перейти до основного матеріалу

Як вибрати найвище або найнижче значення в Excel?

Іноді вам може знадобитися з’ясувати та вибрати найвищі чи найнижчі значення в електронній таблиці чи підборі, наприклад, найбільша сума продажів, найнижча ціна тощо. Ця стаття пропонує вам декілька хитрих порад щодо з’ясування та вибору найвищих і найнижчих значень у виборах.


Дізнайтеся найбільше чи найнижче значення у виділенні за допомогою формул


Щоб отримати найбільше або найменше число в діапазоні:

Просто введіть формулу нижче в порожню клітинку, яку хочете отримати:

Get the largest value: =Max (B2:F10)
Get the smallest value: =Min (B2:F10)

А потім натисніть Що натомість? Створіть віртуальну версію себе у , щоб отримати найбільше чи найменше число в діапазоні, див. знімок екрана:


Щоб отримати найбільше 3 або найменше 3 числа в діапазоні:

Іноді вам може знадобитися знайти найбільше або найменше 3 числа з робочого аркуша. У цьому розділі я ввів формули для вирішення цієї проблеми. Будь ласка, зробіть наступне:

Введіть формулу нижче в клітинку:

Get the largest 3 values: =LARGE(B2:F10,1)&", "&LARGE(B2:F10,2)&", "&LARGE(B2:F10,3)
Get the smallest 3 values: =SMALL(B2:F10,1)&", "&SMALL(B2:F10,2)&", "&SMALL(B2:F10,3)

  • Порада: Якщо ви хочете знайти найбільше або найменше 5 чисел, вам просто потрібно використовувати &, щоб приєднатися до функції ВЕЛИКИЙ або МАЛИЙ, як це:
  • =LARGE(B2:F10,1)&", "&LARGE(B2:F10,2)&", "&LARGE(B2:F10,3)&","&LARGE(B2:F10,4) &","&LARGE(B2:F10,5)

Tips : Занадто складно запам'ятати ці формули, але якщо у вас є Автотекст особливість Kutools для Excel, це допоможе вам зберегти всі необхідні формули та повторно використовувати їх у будь-якому місці в будь-який час і як завгодно.     Клацніть, щоб завантажити Kutools для Excel!


Знайдіть і виділіть найвище або найнижче значення у виділенні за допомогою умовного форматування

Як правило, в Умовне форматування функція також може допомогти знайти та вибрати найбільше або найменше n значень із діапазону комірок, будь-ласка, зробіть так:

1. Клацання Головна > Умовне форматування > Правила зверху / знизу > 10 найкращих предметів, див. скріншот:

2, в 10 найкращих предметів у діалоговому вікні введіть кількість найбільших значень, які потрібно знайти, а потім виберіть один формат для них, і найбільші n значень будуть виділені, див. знімок екрана:

  • Порада: Щоб знайти та виділити найнижчі значення n, вам просто потрібно клацнути Головна > Умовне форматування > Правила зверху / знизу > Внизу 10 предметів.

Виберіть усі найвищі або найнижчі значення у виділенні з потужною функцією

Команда Kutools для Excel's Виберіть Клітини з максимальним і мінімальним значенням допоможе вам не тільки з’ясувати найвищі або найнижчі значення, але й виділити їх усі разом у виділеннях.

Порада:Щоб застосувати це Виберіть Клітини з максимальним і мінімальним значенням По-перше, вам слід завантажити Kutools для Excel, а потім швидко та легко застосувати функцію.

після установки Kutools для Excel, будь ласка, зробіть так:

1. Виберіть діапазон, з яким ви будете працювати, а потім натисніть Кутулс > Select > Виберіть клітинки з максимальним і мінімальним значенням…, див. скріншот:

3, в Виберіть Клітини з максимальним і мінімальним значенням діалогове вікно:

  • (1.) Вкажіть тип комірок для пошуку (формули, значення або обидва) у Заглядати коробка;
  • (2.) Потім перевірте Максимальне значення or Мінімальне значення як вам потрібно;
  • (3.) І вкажіть область, яку тут, будь-ласка, виберіть найбільшу чи найменшу Осередок.
  • (4.) А потім, якщо ви хочете вибрати першу відповідну комірку, просто виберіть Тільки перша комірка варіант, щоб вибрати всі відповідні комірки, будь ласка, виберіть Усі клітини варіант.

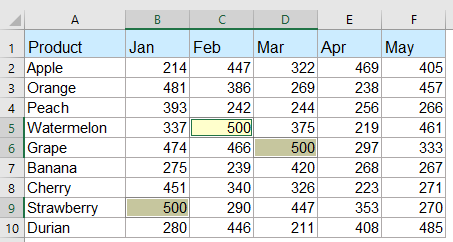
4. А потім клацніть OK, він вибере всі найвищі значення або найнижчі значення у виділенні, див. наступні скріншоти:

Виберіть усі найменші значення

Виділіть усі найбільші значення
Завантажте та безкоштовно пробуйте Kutools для Excel зараз!


Виберіть найвище або найнижче значення в кожному рядку чи стовпці з потужною функцією

Якщо ви хочете знайти та вибрати найвище або найнижче значення в кожному рядку чи стовпці, то Kutools для Excel також можете зробити вам послугу, будь ласка, зробіть наступне:

1. Виберіть діапазон даних, для якого потрібно вибрати найбільше або найменше значення. Потім клацніть Кутулс > Select > Виберіть Клітини з максимальним і мінімальним значенням щоб увімкнути цю функцію.

2, в Виберіть Клітини з максимальним і мінімальним значенням діалогове вікно, встановіть такі операції, як вам потрібно:

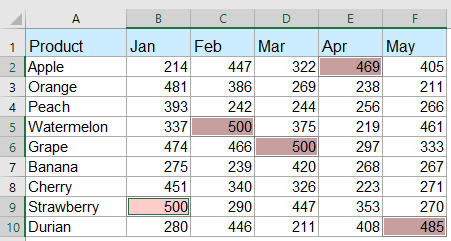
4. Потім натисніть Ok кнопки, одразу обираються всі найбільші або найменші значення в кожному рядку або стовпці, див. скріншоти:

Найбільше значення в кожному рядку

Найбільше значення в кожному стовпці
Завантажте та безкоштовно пробуйте Kutools для Excel зараз!


Виділіть або виділіть усі комірки з найбільшими чи найменшими значеннями в діапазоні комірок або кожного стовпця та рядка

з Kutools для Excel's Виберіть клітинки з максимальними та мінімальними значеннями Ви можете швидко вибрати або виділити всі найбільші або найменші значення з діапазону комірок, кожного рядка або кожного стовпця, як вам потрібно. Будь ласка, дивіться демонстрацію нижче.    Клацніть, щоб завантажити Kutools для Excel!


Більш відносні статті найбільшого чи найменшого значення:

  • Знайдіть і отримайте N-те за величиною значення без дублікатів в Excel
  • На аркуші Excel ми можемо отримати найбільше, друге за величиною або n-те за величиною значення, застосувавши функцію Large. Але, якщо у списку є повторювані значення, ця функція не пропустить дублікати під час вилучення n-го найбільшого значення. Як у цьому випадку ви могли отримати n-те найбільше значення без дублікатів у Excel?
  • Знайдіть у Excel найбільше / найменше унікальне значення
  • Якщо у вас є список чисел, що містить кілька дублікатів, щоб отримати n-те найбільше або найменше значення серед цих чисел, звичайна велика та мала функція поверне результат, включаючи дублікати. Як можна повернути n-те найбільше або найменше значення, ігноруючи дублікати в Excel?
  • Виділіть найбільше / найнижче значення в кожному рядку чи колонці
  • Якщо у вас є кілька даних стовпців і рядків, як би ви могли виділити найбільше чи найнижче значення в кожному рядку чи стовпці? Буде нудно, якщо ви визначатимете значення по одному в кожному рядку чи стовпці. У цьому випадку функція умовного форматування в Excel може зробити вам послугу. Будь ласка, прочитайте більше, щоб дізнатися деталі.
  • Сума 3 найбільших чи найменших значень у списку Excel
  • Для нас звично складати діапазон чисел за допомогою функції SUM, але іноді нам потрібно підсумувати найбільші чи найменші 3, 10 або n чисел у діапазоні, це може бути складним завданням. Сьогодні я представляю вам кілька формул для вирішення цієї проблеми.

Найкращі інструменти продуктивності офісу

🤖 Kutools AI Aide: Революціонізуйте аналіз даних на основі: Інтелектуальне виконання   |  Згенерувати код  |  Створення спеціальних формул  |  Аналізуйте дані та створюйте діаграми  |  Викликати функції Kutools...
Популярні функції: Знайдіть, виділіть або визначте дублікати   |  Видалити порожні рядки   |  Об’єднайте стовпці або клітинки без втрати даних   |   Раунд без Формули ...
Супер пошук: VLookup за кількома критеріями    Багатозначний VLookup  |   VLookup на кількох аркушах   |   Нечіткий пошук ....
Розширений розкривний список: Швидке створення випадаючого списку   |  Залежний спадний список   |  Виберіть розкривний список, що вибирається ....
Менеджер колонок: Додайте конкретну кількість стовпців  |  Перемістити стовпці  |  Перемкнути статус видимості прихованих стовпців  |  Порівняйте діапазони та стовпці ...
Особливості: Фокус сітки   |  Перегляд дизайну   |   Велика панель формул    Диспетчер робочих книг і аркушів   |  Бібліотека ресурсів (автотекст)   |  Вибір дати   |  Об’єднайте робочі аркуші   |  Шифрування/розшифрування клітинок    Надсилайте листи за списком   |  Супер фільтр   |   Спеціальний фільтр (фільтр жирний/курсив/закреслений...) ...
Топ-15 наборів інструментів12 текст Tools (додати текст, Видалити символи, ...)   |   50 + Графік типи (діаграма Ганта, ...)   |   40+ Практичний Формули (Розрахуйте вік на основі дня народження, ...)   |   19 вставка Tools (Вставте QR-код, Вставити зображення зі шляху, ...)   |   12 Перетворення Tools (Числа до слів, Валютна конверсія, ...)   |   7 Злиття та розділення Tools (Розширені комбіновані ряди, Розділені клітини, ...)   |   ... і більше

Покращуйте свої навички Excel за допомогою Kutools для Excel і відчуйте ефективність, як ніколи раніше. Kutools для Excel пропонує понад 300 додаткових функцій для підвищення продуктивності та економії часу.  Натисніть тут, щоб отримати функцію, яка вам найбільше потрібна...

Опис


Вкладка Office Передає інтерфейс із вкладками в Office і значно полегшує вашу роботу

  • Увімкніть редагування та читання на вкладках у Word, Excel, PowerPoint, Publisher, Access, Visio та Project.
  • Відкривайте та створюйте кілька документів на нових вкладках того самого вікна, а не в нових вікнах.
  • Збільшує вашу продуктивність на 50% та зменшує сотні клацань миші для вас щодня!
Comments (39)
Rated 5 out of 5 · 1 ratings
This comment was minimized by the moderator on the site
Hi, any idea why this formula does not work: =MAX(B5,B8,B11,B14)-MIN(B5,B8,B11,B14)

=MAX(B5:B14)-MIN(B5:B14) works but I want just the four cells, not the whole range...
This comment was minimized by the moderator on the site
Hi there,

The formula should work. Is there anything wrong with the data type?

Amanda
This comment was minimized by the moderator on the site
Hi, can u help me. i got some problem on how to retrieve which outlet got lowest growth percentage since the percentage got duplicate value

for example

PEN001 -83.33%
PEN002 -83.33%
PEN003 -92.31%
PEN004 -100.00%
PEN005 -100.00%

I'm using index match min (lowest) & small (for 2nd lowest), but the result will return PEN004 for both condition which is the lowest and 2nd lowest
This comment was minimized by the moderator on the site
Hi,

To ignore the duplicate values and only count unique values, you can use the formula below:
=INDEX(A1:A6,MATCH(SMALL(IF(ISNUMBER(B1:B6),IF(ROW(B1:B6)=MATCH(B1:B6,B1:B6,0),B1:B6)),2),B1:B6,0))

In the above formula, A1:A6 is the list of PEN00N, B1:B6 is the list of percentages, 2 means to get the 2nd lowest value.
https://www.extendoffice.com/images/stories/comments/ljy-picture/2nd_unique_lowest_value.png

Note that this formula works for unique values only, which means it will only return the first value if there are duplicates.

Amanda
This comment was minimized by the moderator on the site
Cześć,

Potrzebuje poznać sposób na rozbudowanie komendy max/min by w docelowej komórce pokazywała wartość wraz z kolorem komórki.

Przykład
mam 3 dostawców z różnymi cenami tych samych produktów (produkty pionowo, dostawcy poziomo)
Dostawcy są przykładowo w kolumnach E,F,G i każdemu przydzieliłem inny kolor, który obowiązuje również ceny danego dostawcy.
W komórkach H chciałbym by pokazała się najniższa cena wraz z kolorem danego dostawcy.

dzięki!
This comment was minimized by the moderator on the site
Hi there,

Let's say the table is as shown below, you could use Excel's Conditional formatting to get the result you want:
https://www.extendoffice.com/images/stories/comments/ljy-picture/example.png

1. Enter =MIN(E1:G1,I1) in cell H1, and then copy the formula to below cells.
https://www.extendoffice.com/images/stories/comments/ljy-picture/get-min.png
2. Selet the list H1: H5, and then on the Home tab, click Conditional Formatting > New rule.
3. In the dialog box, selet Use a formula to determine which cells to format; Enter =$H1=$E1; And then click on Format to choose the background color of cell E1.
https://www.extendoffice.com/images/stories/comments/ljy-picture/create-rule.png
4. Repeat the step 3 to create rules for other background colors: =$H1=$F1 > light blue; =$H1=$G1 > light green; ...

Now, your table should look like this:
https://www.extendoffice.com/images/stories/comments/ljy-picture/result.png

Amanda
This comment was minimized by the moderator on the site
I have a table and I need to sum the columns(which I have done) then I need to find the lowest value (which I have done) how do I display the column title of the lowest value?

Thanks
This comment was minimized by the moderator on the site
Hi, could you please show me a screenshot of your data?

Amanda
This comment was minimized by the moderator on the site
Bonjour Amanda

Ca marche !!!! 😀 🤩 👌
Merci vraiment

Puis-je vous demander de nouveau votre aide ?
Voici la formule que je recherche

A1 A2 A3 A4
Chien Colibri Renard OK
Chat Renard Chien OK
Souris Chien Lion Non
Colibri Ecureuil Marmotte Non
Eléphant Colibri Chat OK

Si en A3 on retrouve les mots des colonnes A1 et A2 alors la colonne A4 indique OK
Si en A3 on ne retrouve pas les mots des colonnes A1 et A2 alors la colonne A4 indique Non

Merci encore pour votre aide très précieuse pour une débutante en excel

Bonne journée
Rated 5 out of 5
This comment was minimized by the moderator on the site
Hi, I don't quite understand why did you asign OK to the first and second rows, since I don't see that the third value is the same as the first or second one.

Amanda
This comment was minimized by the moderator on the site
Bonjour Amanda,

Je vous ai renvoyé le fichier à l'adresse mail indiquée : à l'instant

Merci encore une fois de votre aide.

Bien cordialement
This comment was minimized by the moderator on the site
Hi there,

I tried your excel file in the French enviorment, please use =IF(A1=MAX($A$1:$A$4);1;0).
The seperator should be ";" instead of "," 😅
(If the formula does not work, use SI instead of IF)

Amanda
This comment was minimized by the moderator on the site
Bonjour Amanda

Ne pouvons joindre de fichier sur le site, j'ai répondu au mail que vous m'avez envoyé et j'y ai joins le fichier excel
Vous pourrez voir ainsi que cela me mets en erreur.

Merci encore de votre aide

Bien cordialement
This comment was minimized by the moderator on the site
Hi there,

Did you send the excel file to ?
I did not receive any messages about the issue. Could you please send that again?
Also, I think the .xlsx file is supported to upload here. If you want, you can just upload it here in a comment.

Amanda
This comment was minimized by the moderator on the site
Bonjour,
En premier lieu merci pour tout ça j'y ai trouvé plein plein de soluces.
Ma question est la suivante
J'ai une colonne avec des chiffres

26.56250
25.10400
26.29101
27.66667

Et je voudrais en parallèle une formule qui va me dire non seulement le nombre le plus élevé (ça j'ai trouvé dans vos explications) mais que cette colonne indique 1 pour le chiffre le plus élevé.
Voici un exemple

26.56250 = 0
25.10400 = 0
26.29101 = 0
27.66667 = 1

Pensez-vous que cela soit possible et si oui via quelle formule ?

Je vous remercie encore et par avance en + 😄

Bien cordialement
This comment was minimized by the moderator on the site
Hi there,

Let's say the four values are in range A1:A4, you can enter the below formula in B1:
=IF(A1=MAX($A$1:$A$4),1,0)
And then drag the fill handle down to apply the formula to below cells.
https://www.extendoffice.com/images/stories/comments/ljy-picture/return-1-if-max.png

Amanda
This comment was minimized by the moderator on the site
Bonjour Amandine
Tout d'abord merci pour cette réponse.
Malheureusement cela ne fonctionne pas <font style="vertical-align: inherit;"><font style="vertical-align: inherit;">😞</font></font>

J'ai le message d'erreur habituel
Pouvez-vous m'aider encore une fois ?

Merci
This comment was minimized by the moderator on the site
Hi there,

Can tell me what error it is? I noticed that you are using French, so please try SI instead of IF: =SI(A1=MAX($A$1:$A$4),1,0)

Amanda
This comment was minimized by the moderator on the site
Good day
I have difficulty with excel and don't know the exact names of what I want but will give it a try ?

1. I have 4 Colom's A, B, C, D, =MAX()
9, 2, 4, 1,
I want a formula that include the A,B,C,D, for instance, want the formula to include the "A" and "9" as well like A9?


2 A, B, C, D,
9, 8, 9, 2,
I also need a formula for if there is 2 (or 3 or even 4) equals highs, where I can "A9" and "C9" selected as highest ?

3 base on this information how can I create an automated report for the login user once they have selected the highest value ?

4. Maybe this is not the place to ask, but how can I create a time limit for the usage of the excel workbook that expires after 30 minutes and automatically email the report
to the login user?

5. lastly the report that the user will receive is in word format

Thank you so much
Have a wonderful day
This comment was minimized by the moderator on the site
How do I write a formula to find the smallest percentage in these 3 columns and return the value as LAG Alt or GDF or DEL?
LAG ALT -5% GDF -32% DEL 28%

In example above LAG ALT is the smallest percent/Choice I would want
This comment was minimized by the moderator on the site
Hi, the value to be compared and text string have to be in two cells for excel to compre. I have wrote a formula to get the result you want: =INDEX(A2:C2,MATCH(MIN(ABS(A3:C3)),ABS(A3:C3),0)) Please refer to the screenshot to see how it works. For more details about the formula, please click the link below. I only added ABS function (to get the absolute value) to the formula listed in the article: https://www.extendoffice.com/excel/formulas/excel-get-information-corresponding-to-minimum-value.html
There are no comments posted here yet
Load More
Please leave your comments in English
Posting as Guest
×
Rate this post:
0   Characters
Suggested Locations