0
Undo
Votes
Need some help/guidance please. Whenever I use the Kutools function "Add Trendlines to Multiple Series" for scatter graph (for the entire graph, not just one series), the trendline goes way beyond the data on the x-axis. I checked the series range and it is accurate. Why is the trendline going so far beyond my data, and how do I fix this? TIA 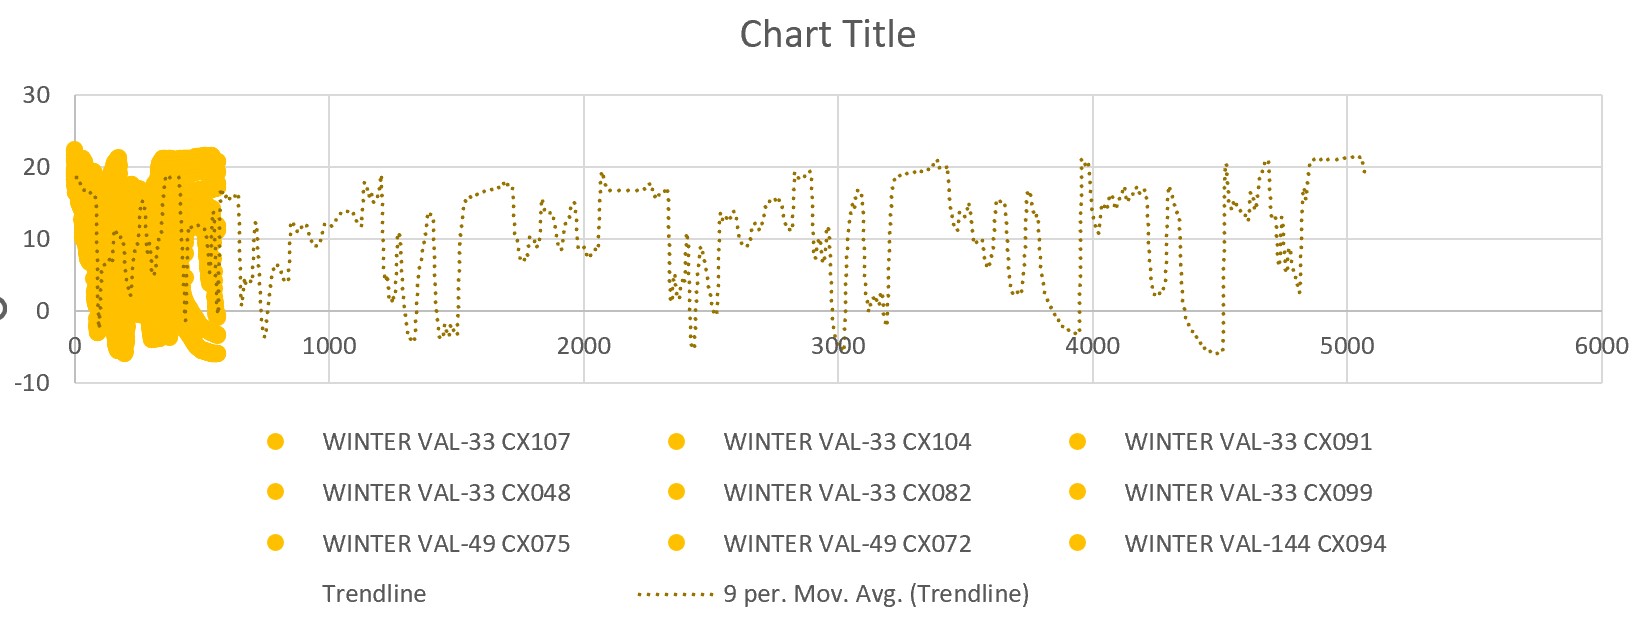


- Page :
- 1
There are no replies made for this post yet.