Перейти до основного матеріалу

Як завжди тримати діаграму в полі зору під час прокрутки в Excel?

Якщо в аркуш вставлена ​​діаграма, коли ви прокручуєте аркуш вниз, щоб переглянути дані, діаграму не можна переглядати одночасно, як показано на знімку екрана, що повинно бути неприємно. У цій статті я представляю код VBA, щоб тримати діаграму завжди в полі зору, навіть незважаючи на прокрутку аркуша вниз або вгору.

doc тримати діаграму в поданні 1
doc стрілка вниз
doc тримати діаграму в поданні 2

Завжди тримайте діаграму в полі зору


стрілка синя права міхур Завжди тримайте діаграму в полі зору

Щоб зберегти діаграму в полі зору під час прокрутки аркуша, ви можете застосувати код VBA для її вирішення.

1. Клацніть правою кнопкою миші на вкладці аркуша, на якій ви хочете, щоб діаграма була видимою, і натисніть Переглянути код формують контекстне меню. Дивіться знімок екрана:
doc тримати діаграму в поданні 3

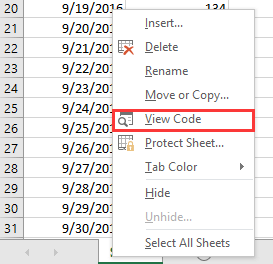
2. У вискакуванні Microsoft Visual Basic для додатків вікно, вставте код нижче в порожній сценарій.

VBA: Тримайте діаграму завжди в полі зору

Private Sub Worksheet_SelectionChange(ByVal Target As Range)
'UpdatebyExtendoffice20161111
    Dim CPos As Double
    Application.ScreenUpdating = False
    CPos = ActiveWindow.ScrollRow * ActiveCell.RowHeight
    ActiveSheet.ChartObjects("Chart 2").Activate
    ActiveSheet.Shapes("Chart 2").Top = CPos
    ActiveWindow.Visible = False
    Application.ScreenUpdating = True
End Sub

doc тримати діаграму в поданні 5

3. Збережіть і закрийте діалогове вікно, тоді діаграма буде переміщена вниз або вгору при натисканні на будь-яку клітинку.
doc тримати діаграму в поданні 6

Примітки:

(1) У коді VBA, діаграма 2 - це назва діаграми, яку ви хочете тримати в полі зору, ви можете змінювати її, як вам потрібно.

(2) Цей VBA не завжди може тримати в полі зору групу діаграм.

Найкращі інструменти продуктивності офісу

🤖 Kutools AI Aide: Революціонізуйте аналіз даних на основі: Інтелектуальне виконання   |  Згенерувати код  |  Створення спеціальних формул  |  Аналізуйте дані та створюйте діаграми  |  Викликати функції Kutools...
Популярні функції: Знайдіть, виділіть або визначте дублікати   |  Видалити порожні рядки   |  Об’єднайте стовпці або клітинки без втрати даних   |   Раунд без Формули ...
Супер пошук: VLookup за кількома критеріями    Багатозначний VLookup  |   VLookup на кількох аркушах   |   Нечіткий пошук ....
Розширений розкривний список: Швидке створення випадаючого списку   |  Залежний спадний список   |  Виберіть розкривний список, що вибирається ....
Менеджер колонок: Додайте конкретну кількість стовпців  |  Перемістити стовпці  |  Перемкнути статус видимості прихованих стовпців  |  Порівняйте діапазони та стовпці ...
Особливості: Фокус сітки   |  Перегляд дизайну   |   Велика панель формул    Диспетчер робочих книг і аркушів   |  Бібліотека ресурсів (автотекст)   |  Вибір дати   |  Об’єднайте робочі аркуші   |  Шифрування/розшифрування клітинок    Надсилайте листи за списком   |  Супер фільтр   |   Спеціальний фільтр (фільтр жирний/курсив/закреслений...) ...
Топ-15 наборів інструментів12 текст Tools (додати текст, Видалити символи, ...)   |   50 + Графік типи (діаграма Ганта, ...)   |   40+ Практичний Формули (Розрахуйте вік на основі дня народження, ...)   |   19 вставка Tools (Вставте QR-код, Вставити зображення зі шляху, ...)   |   12 Перетворення Tools (Числа до слів, Валютна конверсія, ...)   |   7 Злиття та розділення Tools (Розширені комбіновані ряди, Розділені клітини, ...)   |   ... і більше

Покращуйте свої навички Excel за допомогою Kutools для Excel і відчуйте ефективність, як ніколи раніше. Kutools для Excel пропонує понад 300 додаткових функцій для підвищення продуктивності та економії часу.  Натисніть тут, щоб отримати функцію, яка вам найбільше потрібна...

Опис


Вкладка Office Передає інтерфейс із вкладками в Office і значно полегшує вашу роботу

  • Увімкніть редагування та читання на вкладках у Word, Excel, PowerPoint, Publisher, Access, Visio та Project.
  • Відкривайте та створюйте кілька документів на нових вкладках того самого вікна, а не в нових вікнах.
  • Збільшує вашу продуктивність на 50% та зменшує сотні клацань миші для вас щодня!
Comments (15)
Rated 4.75 out of 5 · 2 ratings
This comment was minimized by the moderator on the site
A mí me pasa que la siguiente vez que abro el archivo, el script ya no funciona. Tengo que copiarlo, borrarlo, cerrar el archivo tras guardarlo, volver a abrir el archivo y volver a pegar el script en VBA. ¿Alguna solución?
Rated 4.5 out of 5
This comment was minimized by the moderator on the site
Hi, save the workbook as excel macro enable workbook, the vba will be work when open next time.https://cdn.extendoffice.com/images/stories/comments/sun-comment/doc-macro-enable.png
This comment was minimized by the moderator on the site
I encountered a problem with unselecting the cell and needed two charts, So I made some changes and it seems to work now.
To use it put the right Chart Name.
*Note: This one is for two charts


Private Sub worksheet_selectionchange(ByVal target As Range)
Dim chartposition As Double

chartposition = ActiveWindow.ScrollRow * ActiveCell.RowHeight
ActiveSheet.Shapes("Chart 2").Top = chartposition

ActiveSheet.ChartObjects("Chart 3").Top = chartposition + 250

End Sub
This comment was minimized by the moderator on the site
Can any one assist. when i follow theses steps


Private Sub Worksheet_SelectionChange(ByVal Target As Range)
'UpdatebyExtendoffice20161111
Dim CPos As Double
Application.ScreenUpdating = False
CPos = ActiveWindow.ScrollRow * ActiveCell.RowHeight
ActiveSheet.ChartObjects("Chart 2").Activate
ActiveSheet.Shapes("Chart 2").Top = CPos
ActiveWindow.Visible = False
Application.ScreenUpdating = True
End Sub


i get the following err

Run-Time error '-2147024809 (80070057)':
The item with the specified name was not found

when i debug
ActiveSheet.ChartObjects("Chart 2").Activate
This comment was minimized by the moderator on the site
Hi, Christo, you need to change the chart name "Chart 2" to your chart really name in the script. You can click at the chart and see its name in the name box. See screenshot:
https://www.extendoffice.com/images/stories/comments/sun-comment/do_chart_name.png
This comment was minimized by the moderator on the site
yes thanks. after a made the question i realised my chart name was wrong
thanks

ps.
do you perhaps know how i can make the chart kept in view as i scroll without clicking where it must follow
This comment was minimized by the moderator on the site
can I use Kutools to automatically use that VBA for my charts??
This comment was minimized by the moderator on the site
Sorry, Wangnuli, Kutools has not support this so far.
This comment was minimized by the moderator on the site
Hola muchas gracias por el código, utilizando este código ¿Hay alguna manera de limitar qué tan alto en la hoja se reubicará el gráfico? por ejemplo, no quiero que se coloque encima de la fila 9. Ayuda por favor.
Rated 5 out of 5
This comment was minimized by the moderator on the site
Is there a way to limit how high up on the sheet the chart will relocate to? I don't want it to affix above row 8
This comment was minimized by the moderator on the site
Is there a similar formula that can be built for Google Sheets?
This comment was minimized by the moderator on the site
This macro did exactly what I wanted. However it created another problem that I wondered if you might have a solution to.

While this macro is active I cannot select cells for other purposes such as formatting or merging them. Click and drag, shift nor ctrl work to select a group of cells. I can only select the one cell I clicked on. I frequently want to change formatting (background, fill down a formula, etc.) The only way I have been able to do this is to delete the macro, save, make my formatting changes, paste the macro back in and save.

Is there a simpler way to do this? Perhaps:

1. (preferred) A simple keystroke that would temporarily disable the macro and then re-enable it.

2. Some code added to the macro to allow selection of a group of cells.

Dennis
This comment was minimized by the moderator on the site
This was good but I wish there was a way that it would just move with the scroll wheel, like heading lines. Also if I want to select a cell it takes two clicks. The first click moves the chart but also selects the chart so I have to click again to select the cell.
This comment was minimized by the moderator on the site
I added "activecell.select" on the last line of this code and it fixed the double clicking issue. It will automatically select the last active cell, which will be the one you clicked on to move the chart. Hope this helps.
This comment was minimized by the moderator on the site
THIS IS WHAT I NEEDED! GOLDEN!
There are no comments posted here yet
Please leave your comments in English
Posting as Guest
×
Rate this post:
0   Characters
Suggested Locations